Case Study
Food Base LA: Smart and Connected Food Systems Project
Thanks to a grant from the National Science Foundation, USC, Los Angeles County, and our partners working on food issues, have an opportunity to create a game-changing data dashboard. This dashboard brings together resources from public and private data partners so that we can more effectively monitor, understand, and respond to changes and challenges in our food system.
The data dashboard will be co-developed by the USC team and L.A. County partners to meet their needs for data and information.
Based on this input-driven model, the USC team will identify, analyze, and integrate novel data sources through public-private partnerships (e.g., Yelp, Findhelp, L.A. Regional Food Bank) and present content.
What Data Can Do
Mapping Food Access


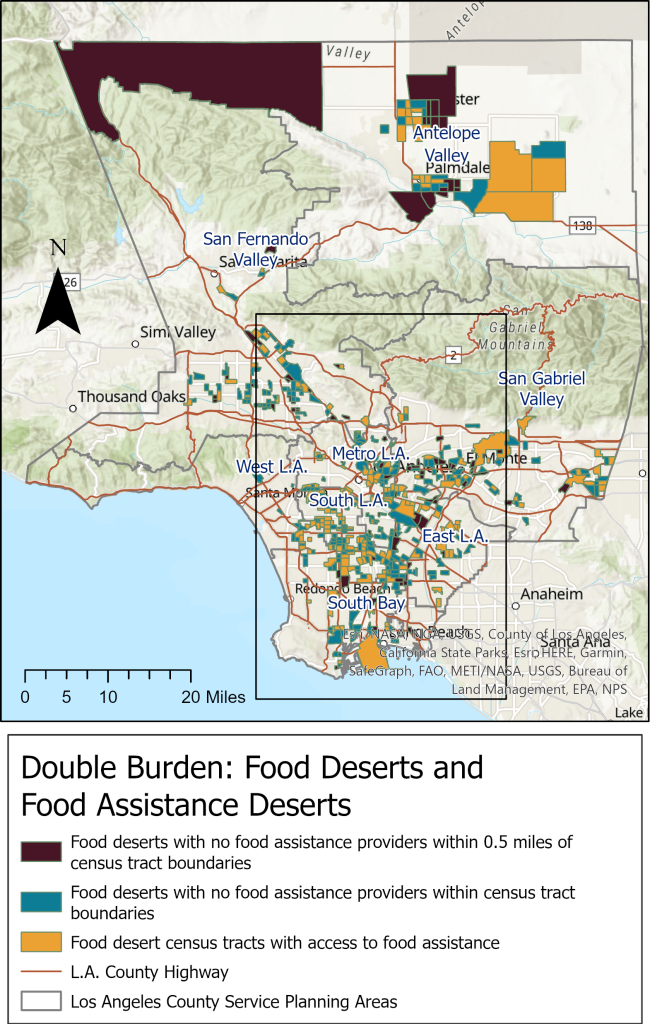
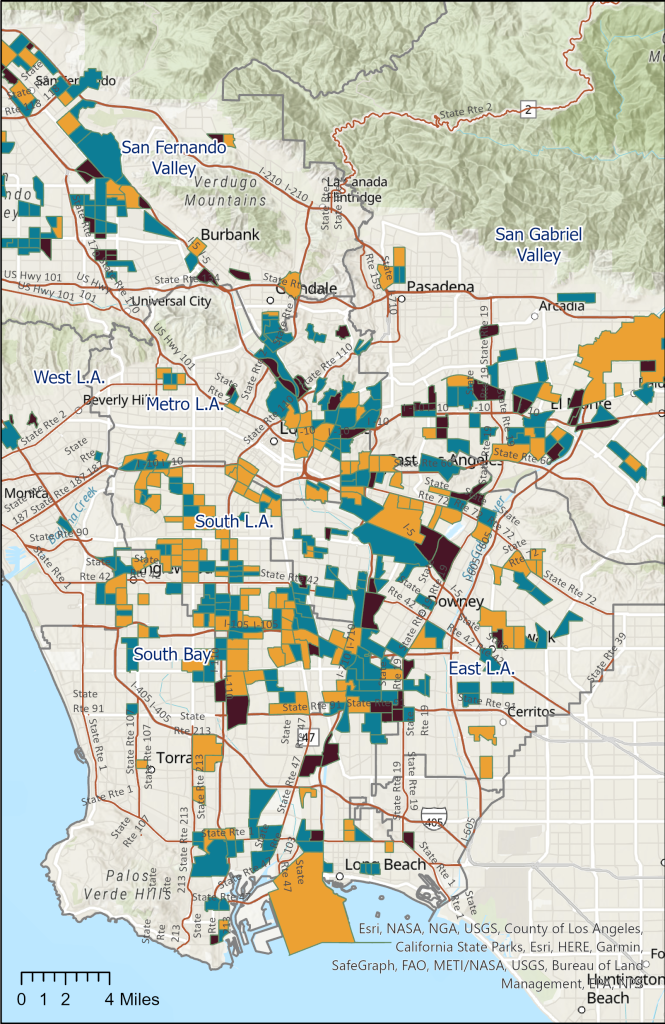
Figure X. Los Angeles County Census Tracts with a Double Burden of Food Desert and Food Assistance Desert, based on data from the U.S. Department of Agriculture, the Los Angeles Regional Food Bank, and Findhelp.org (December 2020).
Census tracts that are (a) food deserts, where many residents are low-income and do not have close access to a supermarket (YELLOW), (b) food deserts with no food assistance providers (e.g., food pantry) within their census tract boundaries (BLUE), and (c) food deserts with no food assistance providers within their census tract boundaries or within 0.5 miles of their boundaries (MAROON) are primarily located in the southern region of L.A. County and clustered around the interstate highways.
Impact
By integrating dynamic data sources and presenting data in useful and actionable ways, the dashboard opens new opportunities to improve nutrition security.
1. Offers new and timely data on the food system as a whole (e.g., residents’ food intake and food security status, access to food and food assistance, government food program reach and neighborhood food environments), to inform program planning, implementation, and evaluation.
2. Offers tools to contextualize the planning and evaluation of county services and programs in the community (e.g., DPSS’s CalFresh program), considering differences and disparities in food environments and food access.
3. Provides early warning on communities or populations at risk for food and nutrition insecurity during a crisis, helping to inform the provision of emergency resources.
4. Builds capacity to evaluate existing and future programs, policies, and interventions. For example, by providing access to nutritional health metrics that are spatially aggregated by location, to identify and address gaps and disparities in health and community food services.
Project Tasks and Timeline
♦ Establish data platform partnership
♦ Host workshops with key food stakeholders; use “systems thinking” and group model building to develop a comprehensive map of factors that matter to nutrition security in L.A. County, identify data and information needs
♦ Establish data partnerships based on information needs, conduct preliminary data analysis
2022♦ Conduct novel data analysis to generate new insights about nutrition security and
the food system in L.A. County
♦ Prototype components of the data dashboard with project partners, and conduct iterative user testing
2023♦ Co-create a comprehensive data dashboard, “Food Base L.A.”, with our project partners to share these novel insights in a timely way and to serve as a decision making tool
♦ Transfer the dashboard to L.A. County for hosting and future sustainability
2024